Beyond SLAs: A Practical Guide to Calculating and Leveraging TTx Metrics for System Reliability

Even of a service with an SLA 99.999%, there is still an allowable downtime of 5 minutes and 16 seconds per year. To clarify the calculation method of the SLA, it is necessary to provide mode detailed metrics for the entire downtime period, and this metric is called TTx (Time to)
TTx
TTx is a set of time metrics for measuting an outage from the relibility/servicing persepctive. The diagram below illustrates the relationship between those metrics, and TTM covers the entire range.
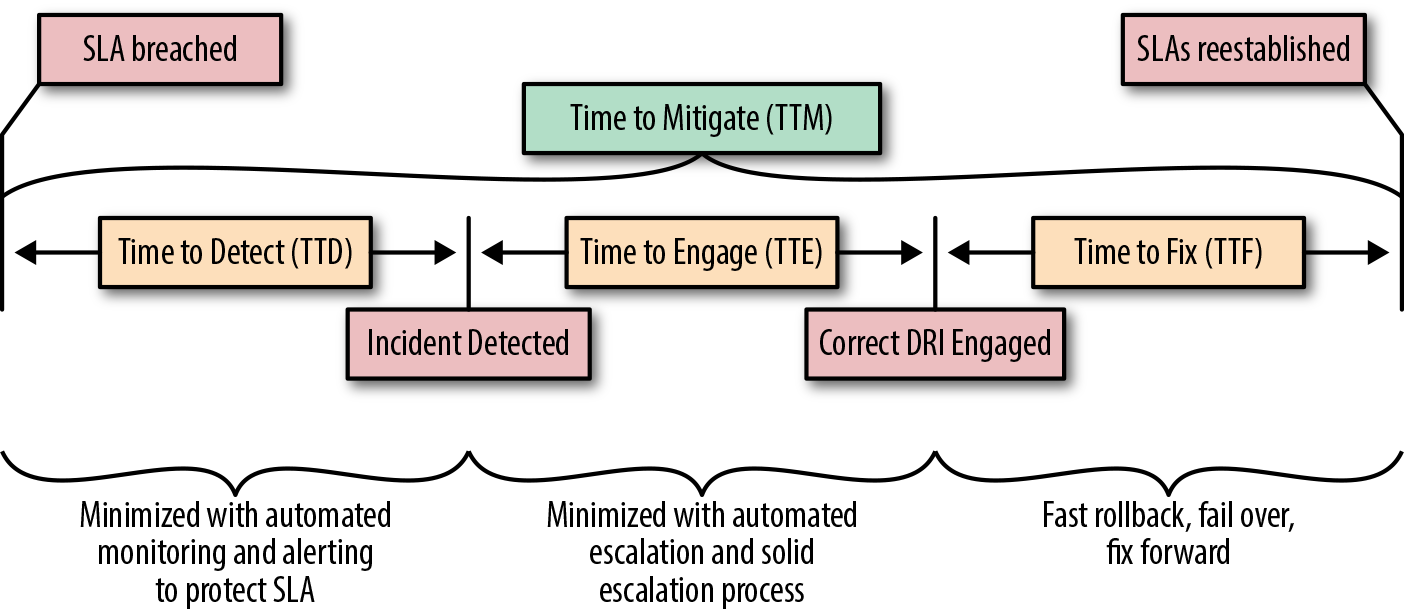
You can also refer to the original post from O'reilly in the diagram to understand the meanings of these TTx metrics
| Abbreviation | Metric Name | Formula | Definition (Mandarin) |
|---|---|---|---|
| TTM | Time to Mitigate | (Incident Mitigation Time, SLA restablished) - (Incident Impact Start Time, SLA breached) | SLA 總消耗時間 |
| TTD | Time to Detect | (Incident Detection Time) - (Incident Impact Start Time, SLA breached) | 發現事件總消耗時間 |
| TTE | Time to Engage | (Last Engineer Engaged <= Mitigation Time) - (Incident Detection Time) | 最後一位進場工程師進場總進場時間 |
| TTF | Time to Fix | (Incident Mitigation Time, SLA restablished) - ((Last Engineer Engaged <= Mitigation Time) | 修復總消耗時間 |
| TTN | Time to Notify | (First Customer Advisory Time) - (Incident Impact Start Time, SLA breached) | 通知使用者總消耗時間 |
Example of TTx
We use the example below to understand the meaning of TTx
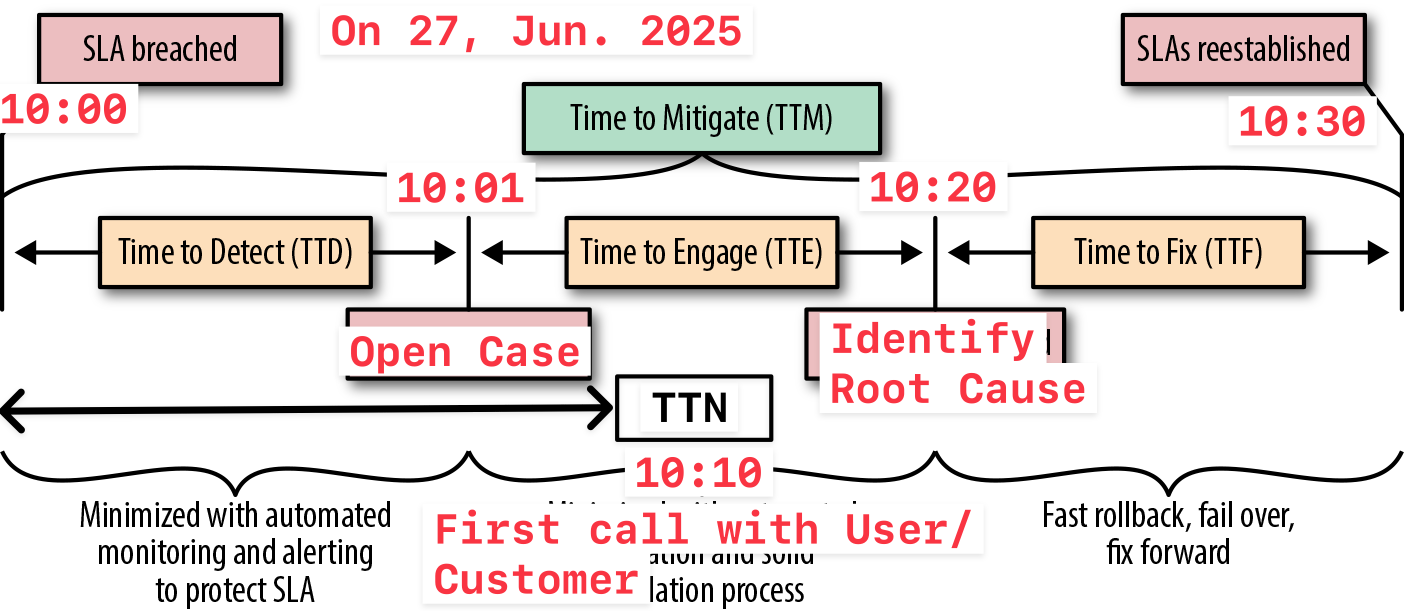
First, we need to record the specific time of each event, as listed below
- 10:00 UTC+8 on 27 June 2025 - Service anomaly occured, SLA breached
- 10:01 UTC+8 on 27 June 2025 - Someone or the monirtoring system has raised a case to notify system administrator
- 10:10 UTC+8 on 27 June 2025 - Someone from the service side began their first conversation with the user or customer
- 10:20 UTC+8 on 27 June 2025 - The last engineer (often also the first) responsible for service side responsible for maintenance identified the root cause
- 10:30 UTC+8 on 27 June 2025 - Service restoration completed, SLA restablished
Based on the above timeline, you can easily calculate the specific indicator time for each TTx
| Abbreviation | Metric Name | Formula (HH:MM) | Total elapsed time |
|---|---|---|---|
| TTM | Time to Mitigate | 10:30 - 10:00 | 30 mins |
| TTD | Time to Detect | 10:01 - 10:00 | 1 min |
| TTE | Time to Engage | 10:20 - 10:01 | 19 mins |
| TTF | Time to Fix | 10:30 - 10:20 | 10 mins |
| TTN | Time to Notify | 10:10 - 10:00 | 10 mins |
The unit of time calculation here is HH:MM. If you need precision down to seconds, you can adjust to HH:MM:ss as the measurement standard.
TTx Improvement
TTD (Time to Detect)
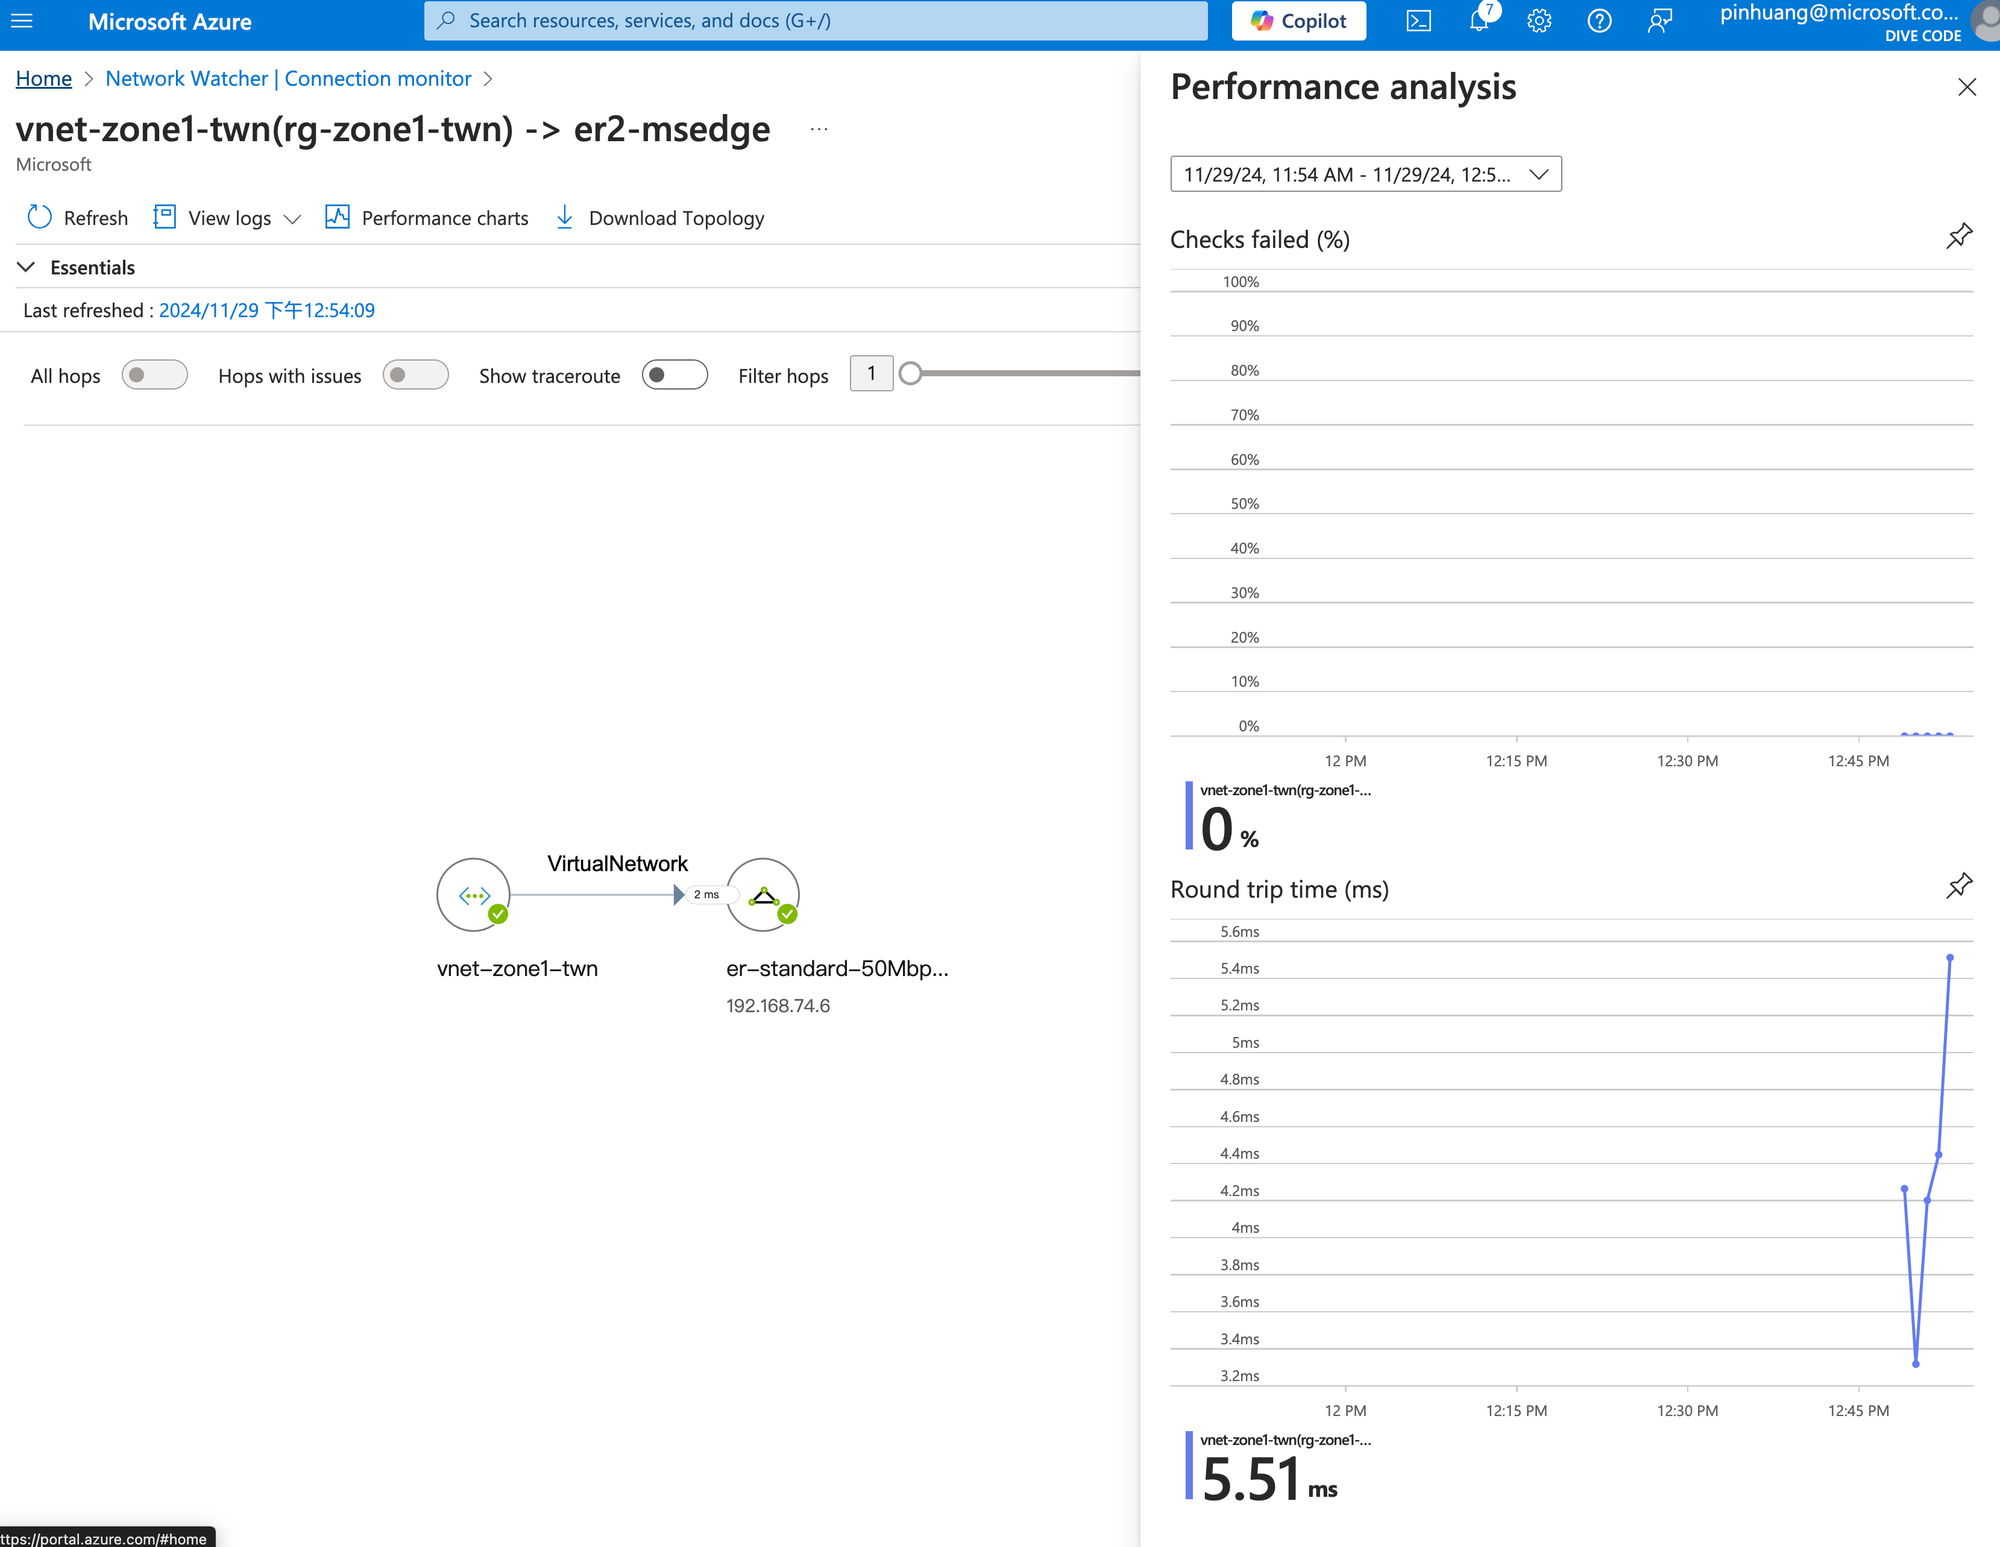
This is the part of the entire restoration process that is easiest to automate and monitor. In addition to using Azure Network Watcher for networking monitor, you can also utilize Azure Managed Prometheus, Azure Managed Grafana, Azure Monitor, or any 3rd parties monitoring and alerting solution to accomplish this.
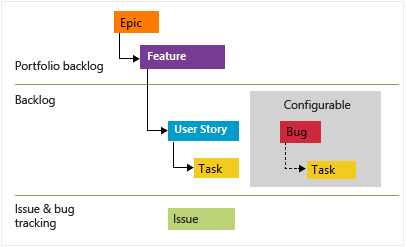
Regarding the creation of incident cases, Azure DevOps can be used to record and manage them by automatically creating Work Items. Of course, I believe that project management on the market with boards / kanban, such as Jira, can certainly achieve the same functionality. This can be evaluated independently.
TTE (Time to Engage)
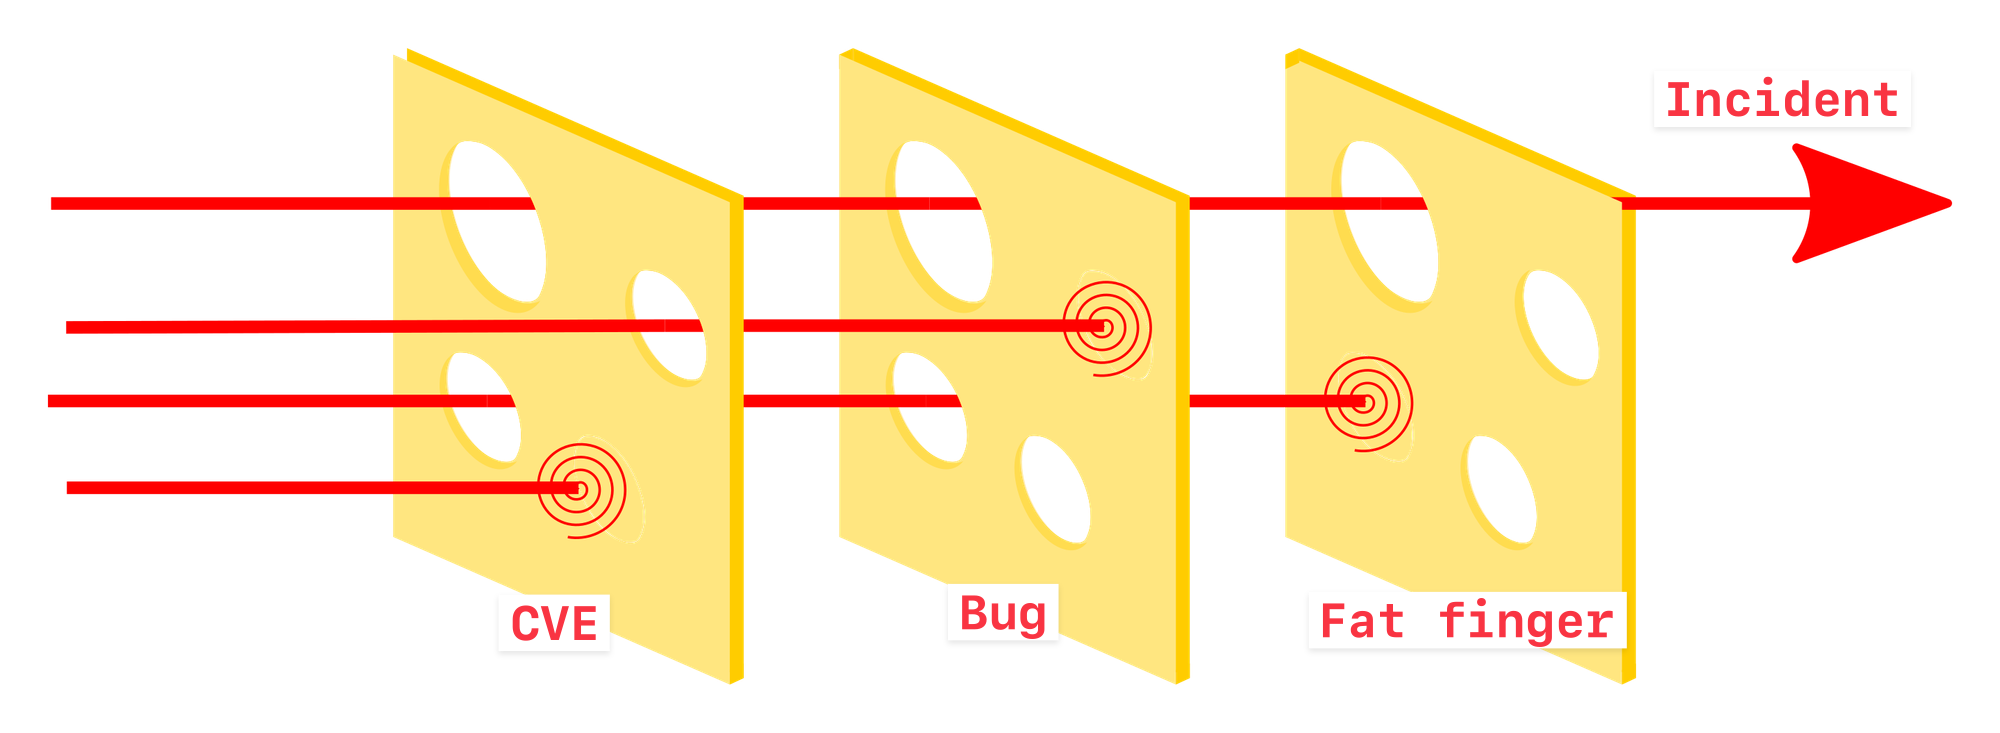
The Swiss cheese model of accident causation illustrates that, although many layers of defense lie between hazards and accidents, there are flaws in each layer that, if aligned, can allow the accident to occur. In this diagram, three hazard vectors are stopped by the defenses, but one passes through where the "holes" are lined up.
This is the most time-consuming part of the entire process. In pratice, it is usually the responsible engineers who collect information and analze a large volume of logs. However, with the advancement of AI, information collection and preliminary assessments are now being carried out through AI, provding references for subsequent engineers. Microsoft has attempted to adopt AIOps technology to optimize the Triangle System - Optimizing incident management with AIOps using the Triangle System. And Google has also launched kubectl-ai for Kubernetes to help administrators more quickly identify and provide solutions.
As data collection becomes more refined, I personally am quite optimistic that AIOps can help many administrator reduce operational pressure. However, the accompanying issue is as humans, How caa we continously cultivate talent to enable them to identify which solution is best for customers or users?
TTD (Time to Fix)
No matter if its a reboot, update, rebuild, hot patch or rollback, it's a solution because, for users, they don't care how you fix it - the key is that the service is restored to normal.
Assuming it's a reboot or rollback, the TTF time shouldn't be too long. In other situations, it might take a very long time, and at that point, alternative solutions MUST BE sought to mitigate the incident
TTN (Time to Notify)
This notification target could be users, customers or your boss. It is recommend to have a single point of contact to provide them with regular and contiinuous updates on information.
The key point of the feedback with users are
- Explain alternative solutions
- Ensure transparency in progress handling
- Provide information about the next steps.
To ensure that engineers can focus on completing repair tasks, it is more sutiable to have dedicated person handle communication, which is usually carried out by a Technical Account Manager (TAM) or Customer Success Account Manager (CSAM).
Phil's Memo
Microsoft Reactor - Azure Incident Retrospectives
Although having an incident is not a good thing, the interesting part is that Microsoft Azure is willing to conduct a restrospective for Azure incident, not only documenting it on Azure Status Histor but also recording the discussion and publicly sharing record on YouTube.